
Recently, the sustainable-computing.io project, Kepler, was added as a Cloud Native Computing Foundation (CNCF) sandbox project.
While deploying a tool dedicated to sustainability, the last thing we’d want is for the tool itself to consume unnecessary energy or resources. This streamlined approach eliminates the need for a resource-heavy monitoring stack on your edge devices. In the end, reducing energy consumption will reduce operational costs. Read on to learn how to make your edge devices greener and more efficient.
Note: Red Hat’s Emerging Technologies blog includes posts that discuss technologies that are under active development in upstream open source communities and at Red Hat. We believe in sharing early and often the things we’re working on, but we want to note that unless otherwise stated the technologies and how-tos shared here aren’t part of supported products, nor promised to be in the future.
What is Kepler?
Kepler emerged from a collaborative effort between Red Hat and IBM Research. The goal is to expand on the concept of estimating system energy consumption. CPU performance counters and ML models are utilized to estimate power usage per pod, workload, namespace or Kubernetes cluster. Paraphrased, Kepler leverages eBPF programs to export per-container energy consumption as Prometheus metrics. This empowers end-users to monitor their containers’ energy consumption and to help make intelligent decisions towards achieving energy conservation goals.
Why is sustainability important at the edge?
Minimizing environmental impact is a compelling reason to incorporate sustainable practices at the edge. However, sustainability is an important consideration for many other reasons. Efficiency with power consumption reduces operating costs, which add up when considering an edge network with a fleet of devices. Additionally, sustainable practices can reduce electronic waste by extending the lifespan of devices and lowering the energy required for data transmission can lead to significant energy savings. As edge computing continues to grow and evolve, integrating sustainability becomes more important and the benefits extend beyond environmental conservation.
Installing Kepler
Kepler is easy to install, and to get up and running with only a few commands. Refer to the Kepler RPM installation guide for more information.
Note: The following commands assume you are SSH’d into a Red Hat Enterprise Linux (RHEL) machine. This will set up a proof-of-concept for running Kepler at the edge, but in a more realistic edge scenario, this process would be automated with Red Hat Ansible Automation Platform or a similar automation platform.
With Red Hat Device Edge, the rpm can be included when building the OS image. For non rpm-ostree RHEL systems, the commands below will install and start Kepler as a systemd service.
$ sudo dnf localinstall kepler-[version.arch].rpm
$ sudo systemctl start kepler.service
Make sure the service is running.
OpenTelemetry Collector
OpenTelemetry is a CNCF incubating project. It is a collection of tools, APIs, and SDKs to instrument, generate, collect, and export telemetry data (metrics, logs, and traces) to help you analyze your software’s performance and behavior. Here, we will use the OpenTelemetry Collector (OTC).
In edge environments—where there is often a limit on CPU, memory, and disk space—a monitoring stack is expensive. Components such as Prometheus and Grafana encroach upon the limited resources available to execute edge workloads. Instead, an OTC offers a lightweight option for exporting metrics. The OTC is a vendor-agnostic proxy that can receive, process and export telemetry data. It supports receiving telemetry data in multiple formats, including Prometheus. Prometheus metrics generated by Kepler will be scraped by the OpenTelemetry Collector and exported to Red Hat OpenShift.
Assumed here is that an OTC is running as a gateway collector in Red Hat OpenShift. Furthermore, the OTC in Red Hat OpenShift is configured to export to Prometheus. An example that enables this in Red Hat OpenShift is described in this guide.
In the example linked above, the OTLP endpoint can be found from the otc route in the Red Hat OpenShift cluster with the following:
$ oc -n observability get route otc -o jsonpath='{.status.ingress[*].host}' > otlp-endpoint
Run the OpenTelemetry Collector locally, as a container with Podman
The steps for running an OTC at the edge from a Podman command, along with a collector configuration example, can be found in this guide. The steps are also outlined below.
First, download the example configuration file.
$ curl -o otel-config.yaml https://raw.githubusercontent.com/redhat-et/edge-ocp-observability/main/edge/sample-app/kepler/non-k8s/otelcol-config.yaml
In this configuration, Kepler metrics are exported to the Red Hat OpenShift gateway OTC.
To secure traffic from the edge OTC to OpenShift OTC, follow this mTLS documentation. This will create a CA and signed certificates for both the server (OpenShift OTC) and client (edge OTC).
Now, run the OTC in a privileged container on the edge host with Podman:
$ sudo podman run --rm -d --name otelcol-host \
  --network=host \
  --user=0 \
  --cap-add SYS_ADMIN \
  --tmpfs /tmp --tmpfs /run  \
  -v /var/log/:/var/log  \
  -v /sys/fs/cgroup:/sys/fs/cgroup:ro \
  -v $(pwd)/mtls/certs/server.cert.pem:/conf/server.cert.pem:Z \
  -v $(pwd)/mtls/certs/client.cert.pem:/conf/client.cert.pem:Z \
  -v $(pwd)/mtls/private/client.key.pem:/conf/client.key.pem:Z \
  -v $(pwd)/otelcol-config.yaml:/etc/otelcol-contrib/config.yaml:Z \
  -v $(pwd)/otc:/otc:Z  \
  quay.io/sallyom/otelcolcontrib:ubi9 --config=file:/etc/otelcol-contrib/config.yaml
Finally, you can deploy Grafana in Red Hat OpenShift with a Prometheus datasource to view the Kepler metrics.
Deploy Grafana and the Prometheus DataSource with Kepler Dashboard
You can query metrics from Prometheus in Red Hat OpenShift, or you can curl the metrics from the edge device. To curl from the edge system:
$ curl localhost:8888/metrics
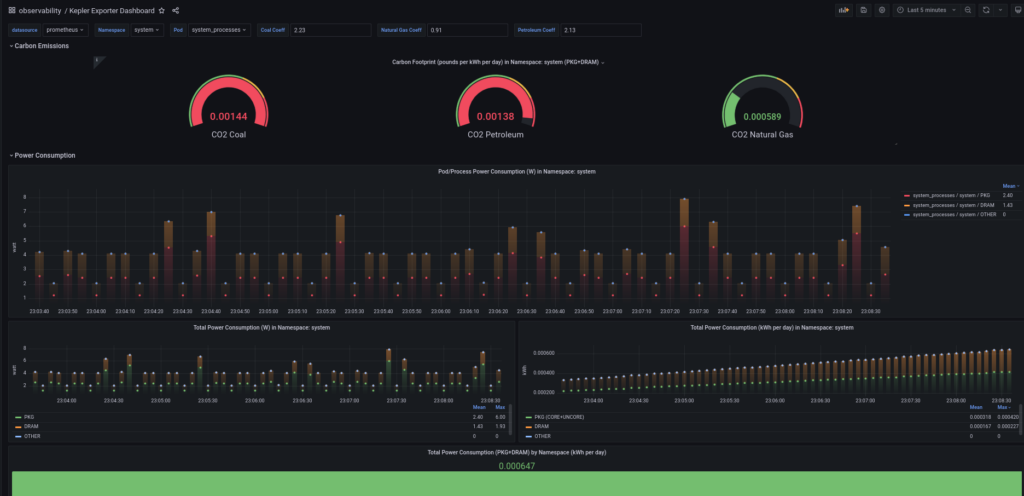
However, you might prefer to view the Prometheus metrics in Grafana with the upstream Kepler exporter dashboard.
To deploy Grafana, Prometheus, and the Kepler dashboard, follow this guide.
You should now be able to access Grafana with username: rhel, password: rhel from the Grafana route.
- Navigate to Dashboards -> find Kepler Exporter dashboard.
- Navigate to Explore -> query metrics from the Prometheus data source.
Hopefully, you’ll see something like this!
And there you have it! For more detailed information about the architecture, design, and roadmap of Kepler, please visit the documentation, previous post, or best yet join the bi-weekly community meetings!