With an increase in the number of applications being deployed on Red Hat OpenShift, there is a strong need for application monitoring. A number of these applications are monitored via Prometheus metrics, resulting in an accumulation of a large number of time-series metrics stored in a TSDB (time series database). Some of these metrics can have anomalous values, which may indicate issues in the application, but it is difficult to identify them manually. To address this issue, we came up with an AI-based approach of training a machine-learning model on these metrics for detecting anomalies.
The Fourier and Prophet machine-learning models are currently being used to perform time-series forecasting and predict anomalous behavior in the metrics. We are also researching other classical time series forecasting models such as the ARIMA model.
AI Ops approach and implementation
With the increased amount of Prometheus metrics flowing, it is getting harder to see the signals within the noise. The current state of the art is to graph out metrics on dashboards and alert on thresholds, which is currently done by domain knowledge, i.e.
, the people that know the system come up with these thresholds.
Through an AI-based approach, we can train machine learning models on historic metric data to perform time-series forecasting. The true metric values can then be compared with the model predictions. If the predicted value differs a lot from the true metric value, we can report this as anomalous behavior.
The main requirements for our Prometheus anomaly detection framework are:
- Prometheus Metrics – Metrics of interest that need to be monitored
- OpenShift – A namespace for deploying Prometheus, the ML models, and Grafana
- Grafana – Visualization tool compatible for creating graphs of the Prometheus time series data
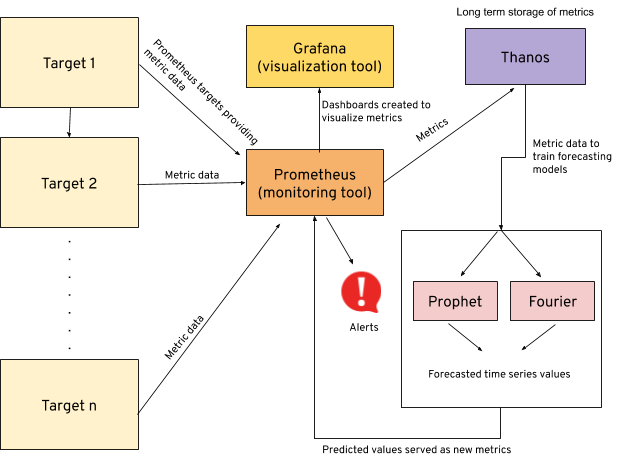
The current implementation of our anomaly detection framework is as follows: 
- Data – Prometheus time-series metrics scraped from specified hosts/targets.
- Models being trained –
- Fourier – It is used to map signals from the time domain to the frequency domain. It represents periodic time series data as a sum of sinusoidal components (sine and cosine)
- Prophet – Prophet model is developed by Facebook for forecasting time series data based on an additive model where non-linear trends are fit with yearly, weekly, and daily seasonality, plus holiday effects. It works best with time series that have strong seasonal effects and several seasons of historical data. The following are the forecasted values calculated by the model
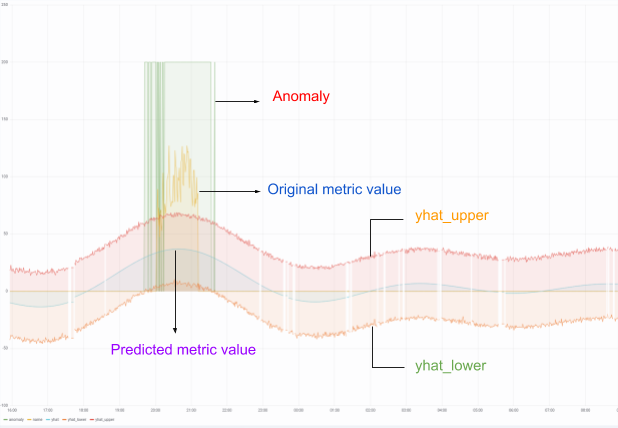
- yhat – Predicted time series value
- yhat_lower – Lower bound of the uncertainty interval
- yhat_upper – Upper bound of the uncertainty interval
- Visualization – We can visualize the time series metric behavior by creating graphs in Grafana. For example, we can plot and compare the actual and predicted metric values through the following dashboard:

This dashboard plots the current metric value, predicted metric value, upper and lower bounds for the predicted value and the anomaly detected.
- Alerting – The anomalies detected are sent out as alerts using Prometheus. The alerts are configured to send automated messages through a chatbot via Google Chats and email, notifying the respective teams. The Google Chat alerting architecture is maintained in two parts:
- The predicted metrics are scraped by the Datahub Prometheus.
- Datahub sends a webhook trigger to teams using the Thoth Bot-Sesheta, which is configured to trigger alert notifications in Google Chat.
The Prometheus instance was configured with alerting rules for the anomaly detection metrics. Alerting rules allow you to define alert conditions based on Prometheus expression language expressions and to send notifications about firing alerts to an external service. Whenever the alert expression results in one or more vector elements at a given point in time, the alert counts as active for these elements’ label sets.
Model Testing
For a given timeframe of a metric, the Prometheus anomaly detector can also be run in `test-mode`, to check whether the machine learning models reported back these anomalies. The accuracy and performance of the models can then be logged as metrics to MLFlow for comparing the results.
MLflow is an open source platform to manage the ML lifecycle, including experimentation, reproducibility,. and deployment. It currently offers three components:
- MLflow Tracking
- MLflow Projects
- MLflow Models
The test mode is useful for data scientists to track the model experiments locally on their machine, organize code in projects for future reuse, and output the best performing model to be deployed for production.
Insights and Observations
The anomaly detection was tried for one of our internal team’s metrics, the Thoth Dgraph metrics. The Thoth team wanted to have real-time as well as future prediction of the read-write failure of their graph database. This requirement was brought to the AI Ops team to provide anomaly prediction of the read-write failure of Thoth Dgraph instance.
The detection was valid in the sense that whenever an anomaly was predicted, it was observed that the Dgraph database was indeed failing. The assurance of the anomaly detection was inspected by the alert setup. The alerts were notified by email and Google Chat notifications sent to the Thoth team.
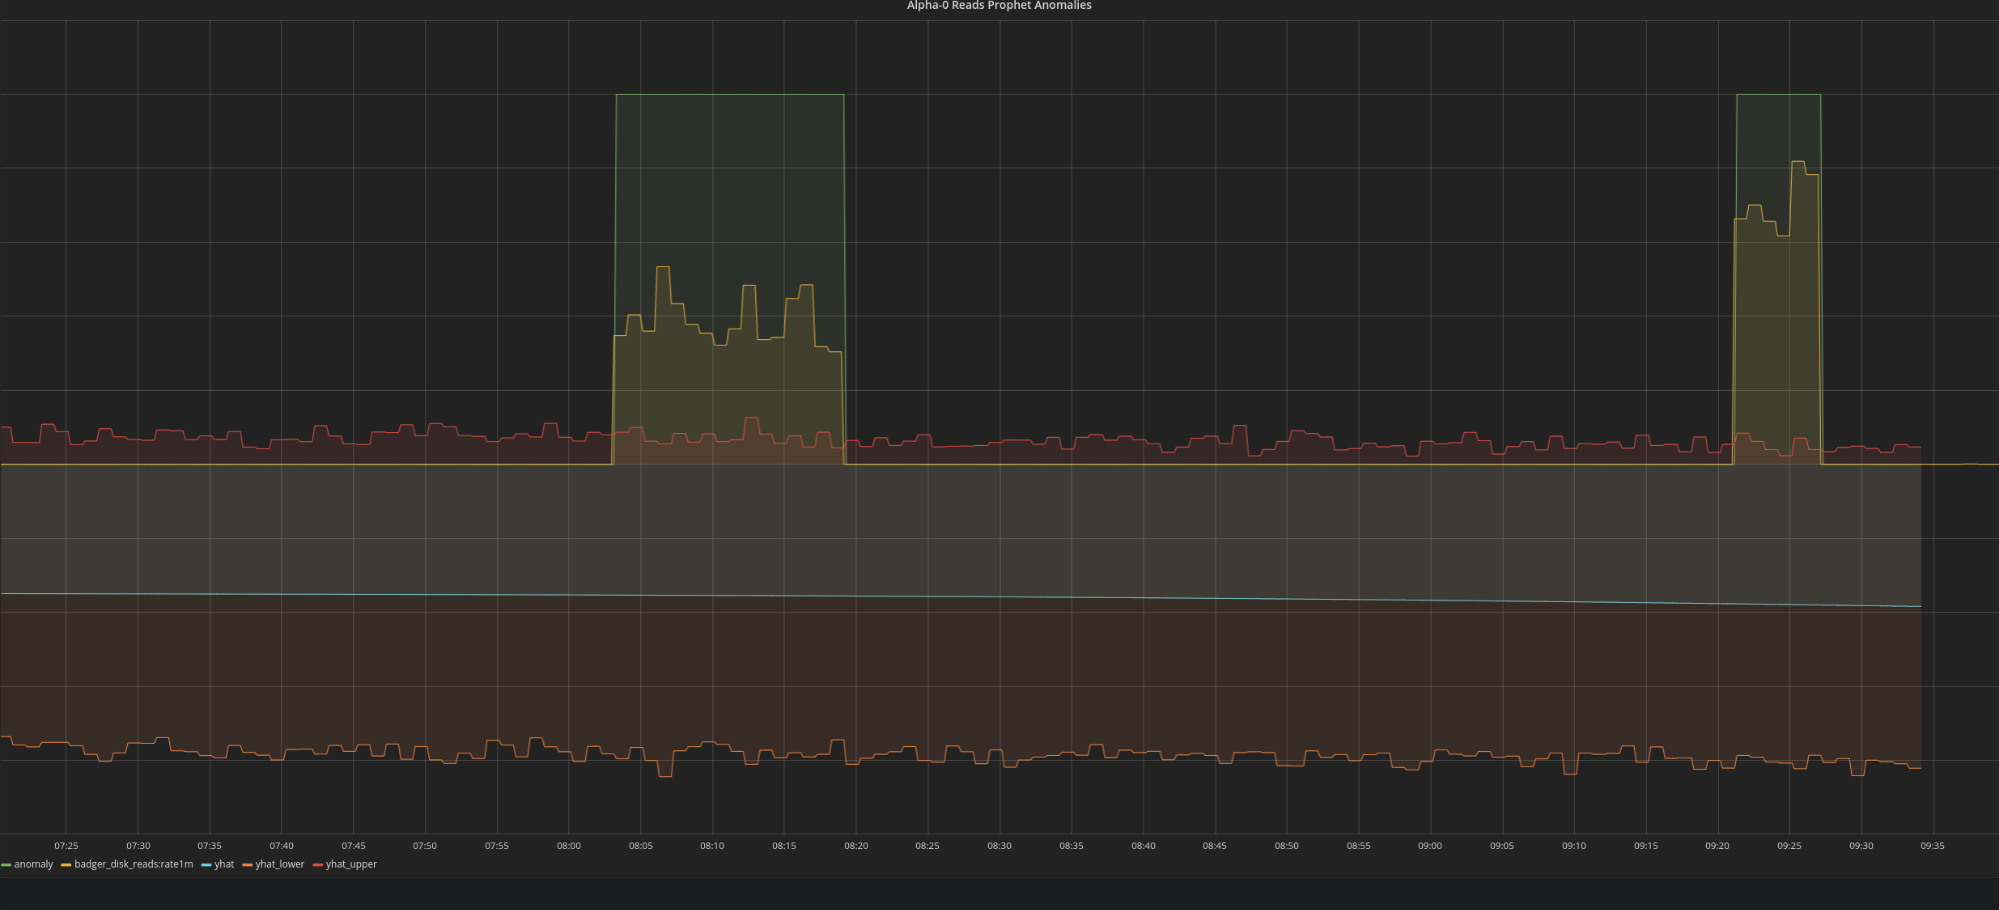
One of the incidents discovered was the PSI cluster being down causing the Dgraph read/write failures, as the Dgraph instance runs on the OpenShift PSI cluster. During this cluster maintenance, the Prometheus anomaly detection triggered alerts for the Dgraph read/write failures.

Grafana dashboard: anomaly detection during PSI cluster maintenance
The following depicts how alerts are sent to the team’s Google chat room:

Failure in the disk read metric based upon Fourier Prediction

Failure in the disk write metric based upon Prophet Prediction
Conclusion
Working with the Thoth Dgraph metrics helped us improve our existing machine learning models. It also led us to consider different possibilities of testing this framework for a wider range of data set, not limiting its use to a specific metric type.
Are you considering using AI to improve your Prometheus monitoring? Please do reach out to the AI Ops team at the AI CoE and we would be glad to assist! We are also open to contributions for improving the framework!
Project Repository: https://github.com/AICoE/prometheus-anomaly-detector
Acknowledgements
Thanks to everyone who helped in any possible way.
AI Ops: Marcel Hild, Anand Sanmukhani, Michael Clifford, Hema Veeradhi
Thoth: Christoph Goern, Francesco Murdaca, Frido Pokorny, Harshad Nalla
Datahub: Alex Corvin and Maulik Shah
