
Note: Red Hat’s Emerging Technologies blog includes posts that discuss technologies that are under active development in upstream open source communities and at Red Hat. We believe in sharing early and often the things we’re working on, but we want to note that unless otherwise stated the technologies and how-tos shared here aren’t part of supported products, nor promised to be in the future.
OpenTelemetry is an observability framework that provides APIs and tools to handle telemetry data, such as traces, metrics, and logs. Our previous post on OpenTelemetry and the OpenTelemetry Protocol (OTLP) discussed the instrumentation required to export OTLP traces from an application.
We instrumented CRI-O, the container engine for Red Hat OpenShift and Kubernetes, to generate and export trace data. The focus of this post is the collection and visualization of OpenTelemetry traces. Read on to view CRI-O, APIServer, and Etcd traces from Kubernetes and OpenShift.
In a complex system like Kubernetes, distributed tracing reduces the time it takes to troubleshoot cluster performance issues. Tracing provides a clear view of transactions as they move through a system. Data is correlated across multiple processes and services that make up end-to-end requests.
The context propagation that tracing provides and the consistent structure of OTLP data enhances information gathered from metrics alone. As Kubernetes and cloud-native applications become more distributed and complex, tracing is essential to understand and debug services and workloads.
In this post, we illustrate how we used the OpenTelemetry Collector to collect and export OTLP traces to Jaeger, an open source software that enables the visualization of trace data. There are two videos: one that captures collecting traces from CRI-O, APIServer, and Etcd, and another showing CRI-O traces collected from a multiple node OpenShift cluster. We also provide an overview of the configuration necessary to collect and export the spans.
Kubernetes with CRI-O, APIServer, and etcd traces
The most recent Kubernetes APIServer release (1.22) and the latest version of etcd (3.5.0) include experimental OpenTelemetry trace exporting.
The following video demonstrates the deployments and configuration required to export, collect, and visualize CRI-O, APIServer, and etcd telemetry traces from a single-node kubeadm cluster.
CRI-O traces in OpenShift
CRI-O traces can also be collected from OpenShift, running three control-plane nodes and three compute nodes. With a multinode Kubernetes cluster such as OpenShift, each node is running CRI-O as a systemd service.
The cluster network that enables communication between cluster services cannot be used to collect data from CRI-O. The CRI-O traces are exported to an OpenTelemetry Collector agent running as a DaemonSet on each node’s host network, then to a single OpenTelemetry Collector deployment that exports to Jaeger over the cluster network.
By enabling hostNetwork on the agent pods, the pods can use the network namespace and network resources of the node. In this case, the pod can access loopback devices, listen to addresses, and monitor the traffic of other pods on the node.
The next video demonstrates the deployments and configuration required to collect CRI-O telemetry traces from OpenShift and visualize them with Jaeger.
Trace collection overview
Each CRI-O server’s trace exporter connects to an agent pod at 0.0.0.0:4317 of each node to export its OTLP data. Upon receiving OTLP from the host, each agent pod then exports the OTLP data to a single OpenTelemetry Collector deployment and pod running in the same namespace as the agents. From the OpenTelemetry Collector, OTLP data is exported to the backend(s) of choice, in this case, Jaeger.
The CRI-O trace collection includes the following steps:
- An OpenTelemetry-Agent DaemonSet and an OpenTelemetry Collector deployment are installed in the cluster.
- The agent pods receive OTLP data from CRI-O, the APIServer, and Etcd. The agent then exports OTLP data to the OpenTelemetry Collector.
- The Jaeger Operator is installed and watches for Jaeger Custom Resources.
- A Jaeger Custom Resource is created in the same namespace as the OpenTelemetry Collector.
- The OpenTelemetry Collector pod receives OTLP data from the agent and exports OTLP data to the Jaeger pod.
- The trace data is displayed with the Jaeger frontend.
Installing OpenTelemetry
To begin capturing CRI-O traces using OpenTelemetry, first install the OpenTelemetry Collector and agent. We added cluster-admin cluster_role to the service account. In production, only the necessary permissions should be granted to the service account.
kubectl create namespace otel
kubectl apply -f sa-otel.yaml -n otel
Create the otel-agent and otel-collector YAML objects. For convenience, the necessary resources are combined in a single YAML file.
kubectl create -n otel -f https://raw.githubusercontent.com/husky-parul/cri-o/otel-doc/tutorials/otel/otel-config.yaml
This will create two configmaps: otel-agent-conf and otel-collector-conf. otel-agent is created as a DaemonSet and otel-collector is created as a deployment. Once the service is up and running, take the ClusterIP from the otel-collector service and update the OTLP exporter endpoint in the otel-agent-conf configmap as:
kubectl get service otel-collector -n otel # This will show the ClusterIP for the service
kubectl edit cm/otel-agent-conf -n otel -o yaml
...
 exporters:
   logging:
   otlp:
    endpoint: "ClusterIP:4317" # ClusterIP for otel-collector service
Now delete the three agent pods so the otel-agent DaemonSet can launch new pods with the updated endpoint.
kubectl delete pods --selector=component=otel-agent -n otel
Check otel-collector pod logs to see traces. You should see traces like:
kubectl logs --selector=component=otel-collector -n otel

2021-06-15T13:38:56.990Z    INFO  loggingexporter/logging_exporter.go:42 TracesExporter {"#spans": 110}
2021-06-15T13:38:58.995Z    INFO  loggingexporter/logging_exporter.go:42 TracesExporter {"#spans": 23}
2021-06-15T13:39:02.001Z    INFO  loggingexporter/logging_exporter.go:42 TracesExporter {"#spans": 55}
2021-06-15T13:39:04.005Z    INFO  loggingexporter/logging_exporter.go:42 TracesExporter {"#spans": 77}
Since Jaeger is not running right now, you will also notice the error in the collector log pictured below, but that will be resolved as soon as you install and create Jaeger.
Jaeger exporter: rpc error: code = Unavailable desc = connection error: desc = \"transport: Error while dialing dial tcp: lookup jaeger-collector.otel.svc.cluster.local on 172.30.0.10:53: no such host\"", "interval": "5.934115365s"}
Installing Jaeger
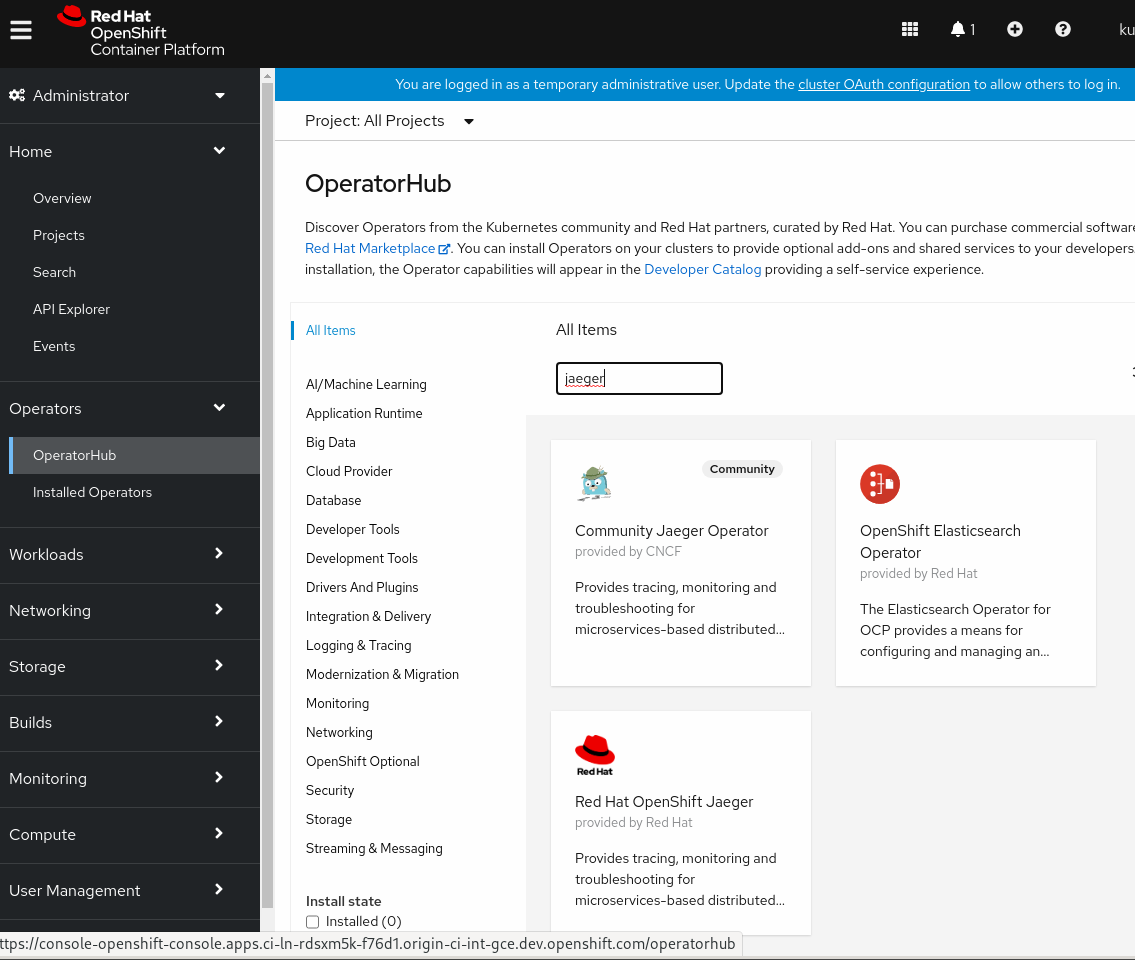
The Jaeger Operator can be installed from the command line, or, if running in OpenShift, it can be installed from the console and OperatorHub.
Steps to install Jaeger from the command line
The commands to install the Jaeger Operator in Kubernetes can be copied and pasted from the Jaeger tracing documentation. These commands deploy the operator in the observability namespace.
After the Jaeger Operator is installed, edit the deployment to observe all namespaces, rather than only the observability namespace that the operator is deployed in.
kubectl edit deployments/jaeger-operator -n observability
 ...
 spec:
   containers:
   - args:
    - start
    env:
    - name: WATCH_NAMESPACE
     value: ""
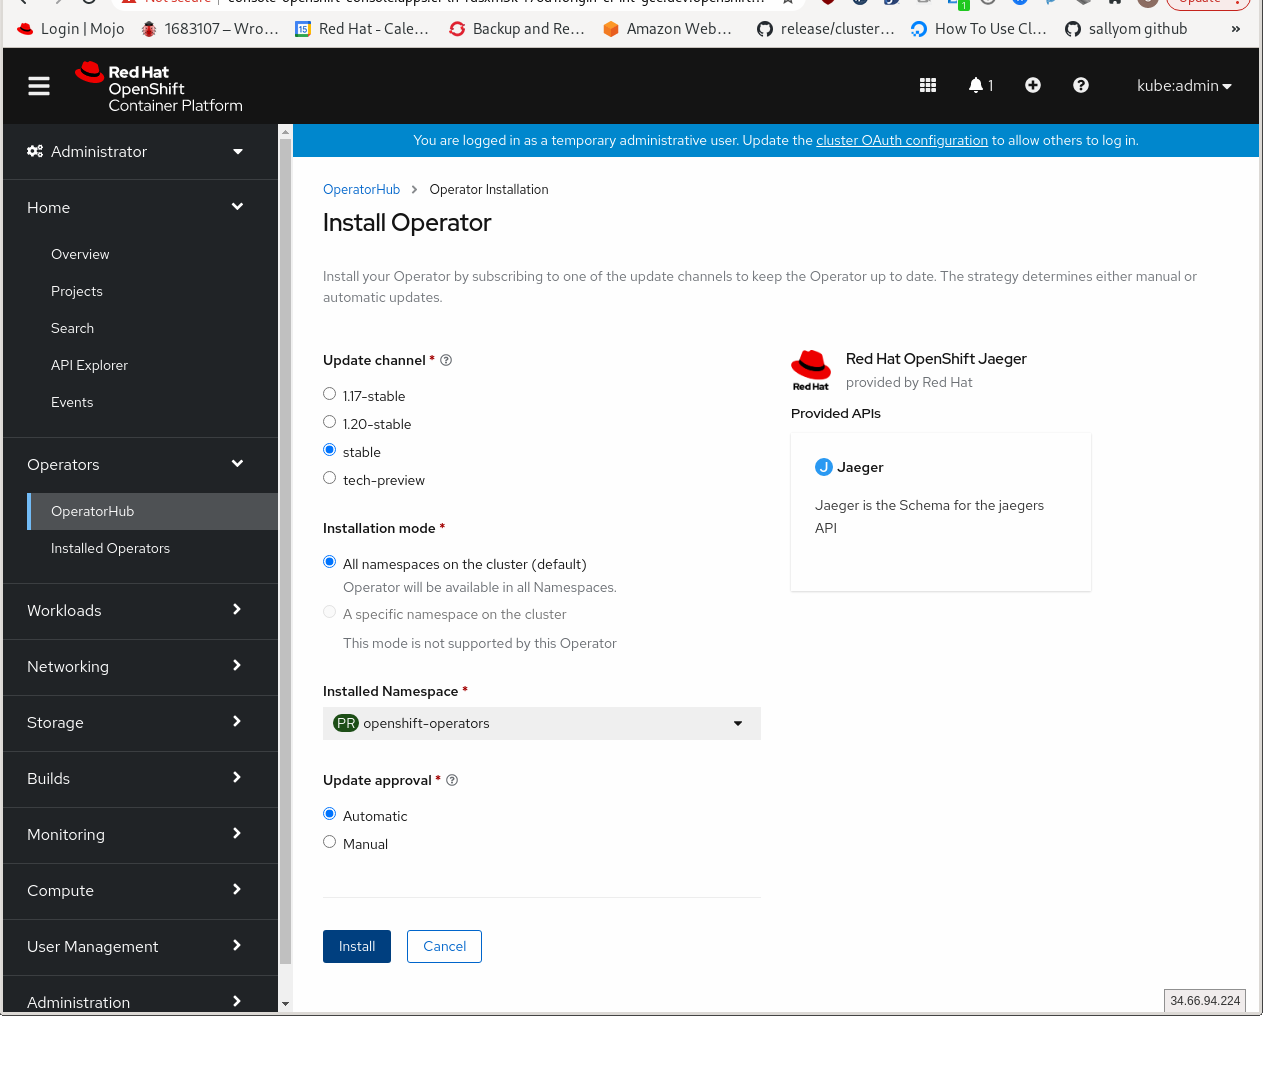
Steps to install Jaeger from OpenShift Console
If running in OpenShift, it is easy to install the Jaeger operator from the OperatorHub. The following screenshots show this path.

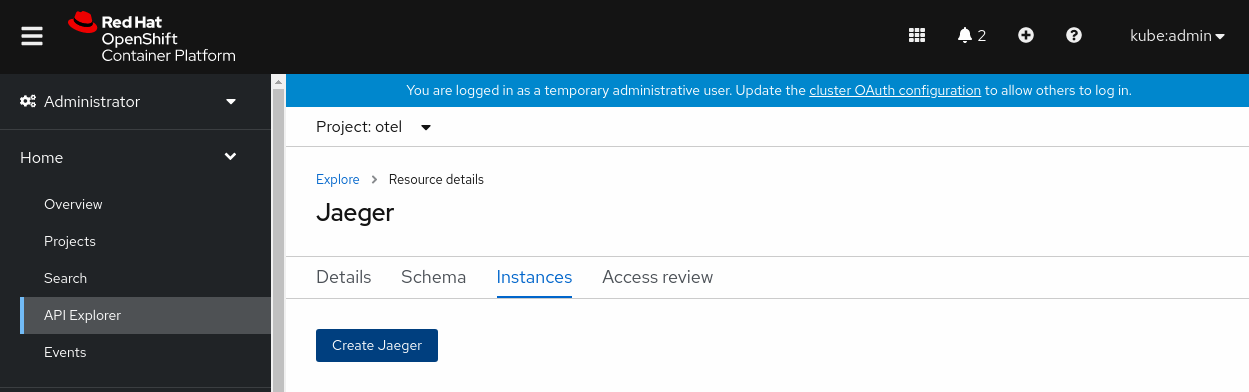
Create a Jaeger instance and view the traces
Once the Jaeger Operator is running and is watching all namespaces (the default with OperatorHub install), create a Jaeger instance in the otel namespace.
This will trigger the deployment and creation of Jaeger resources in the otel namespace. The simplest way to create a Jaeger instance is by creating a YAML file like the following example or by installing a Jaeger instance from the console if running in OpenShift. This will install the default AllInOne strategy, which deploys the all-in-one image (agent, collector, query, ingester, Jaeger UI) in a single pod, using in-memory storage by default.
cat <<EOF | kubectl apply -n otel -f -
apiVersion: jaegertracing.io/v1
kind: Jaeger
metadata:
 name: jaeger
EOF
Check whether the Jaeger instance is up and running:
oc get pods -l app.kubernetes.io/instance=jaeger -n otel

NAME            READY   STATUS  RESTARTS  AGE
jaeger-6499bb6cdd-kqx75   1/1    Running  0     2m
The otel-collector-conf configmap needs to be updated with the Jaeger endpoint. To do so, first acquire the jaeger-collector ClusterIP:
oc get svc -l app=jaeger -n otel

NAME            TYPE    CLUSTER-IP    EXTERNAL-IP  PORT(S)                 AGE
jaeger-agent        ClusterIP  None       <none>    5775/UDP,5778/TCP,6831/UDP,6832/UDP   19m
jaeger-collector      ClusterIP  172.30.120.153  <none>    9411/TCP,14250/TCP,14267/TCP,14268/TCP  19m
jaeger-collector-headless  ClusterIP  None       <none>    9411/TCP,14250/TCP,14267/TCP,14268/TCP  19m
This IP will be added to the otel-collector-conf configmap:
oc edit cm/otel-collector-conf -n otel
...
exporters:
   logging:
   jaeger:
    endpoint: "172.30.120.153:14250" # Replace with a real endpoint.
Delete the otel-collector pod so that a new collector pod is created with the Jaeger endpoint. The new otel-collector pod will have logs indicating that a connection to the Jaeger exporter has been established.
oc delete pod --selector=component=otel-collector -n otel
oc logs --selector=component=otel-collector -n otel
2021-06-17T16:02:07.918Z    info  builder/exporters_builder.go:92 Exporter is starting... {"kind": "exporter", "name": "jaeger"}
2021-06-17T16:02:07.918Z    info  jaegerexporter/exporter.go:186 State of the connection with the Jaeger Collector backend  {"kind": "exporter", "name": "jaeger", "state": "CONNECTING"}
2021-06-17T16:02:08.919Z    info  jaegerexporter/exporter.go:186 State of the connection with the Jaeger Collector backend  {"kind": "exporter", "name": "jaeger", "state": "READY"}
View the spans in Jaeger UI
If running in OpenShift, access the Jaeger route created in the otel namespace.
If running in a Kubernetes cluster, you can port-forward the jaeger-query pod to localhost:16686.
OpenShift
kubectl get routes -n otel

NAME   HOST/PORT                                 PATH  SERVICES    PORT  TERMINATION  WILDCARD
jaeger  jaeger-otel.apps.ci-ln-lwx6n82-f76d1.origin-ci-int-gce.dev.openshift.com     jaeger-query  <all>  reencrypt   None
Kubernetes single node
Jaeger UI will be accessible at localhost:16686
kubectl port-forward <oteljaeger-pod> -n otel 16686:16686
CRI-O Traces

APIServer, Etcd Traces


Conclusion and author notes
These examples and videos will help anyone looking to collect OpenTelemetry traces from an application. We included the information we wish we’d had in one place when embarking on our OpenTelemetry journey. A few points to note:
- Security wasn’t prioritized: privileges can be minimized by using targeted SecurityContextConstraints rather than giving the service account full admin access. The DaemonSet and deployments can be more secure by only exposing the ports that are required. We left extra ports exposed in our YAML files to experiment with other OpenTelemetry backends.
- The Go-OpenTelemetry API is not stable yet. We hit a few bumps where the API was not backward compatible with the last few tags. We are currently using the tag v1.0.0.
OpenTelemetry provides a single export protocol that enables data to be exported to any or multiple backends. Without the OTLP specification and without community support of the standard, only the tracing backend compatible with an application’s export protocol can be used. Now, with OTLP, application owners are not locked into a single vendor, nor do they have to add code to add or switch tracing backends.
Next up? We will add instrumentation to the kubelet, kube-scheduler, and the controller-manager. Stay tuned!