Istio exists to make life easier for application developers working with Kubernetes. But what about making Istio easier? Well, that’s Kiali’s job. Read on to learn more about making Istio even more pleasant to use.
Deploying and managing microservice applications is hard. When you break down an application into components, you add complexity in how those components communicate with each other. Getting an alert when something goes wrong, and figuring out how to fix it, is a challenge involving networking, storage, and potentially dozens of different compute nodes.
One of the main ideas behind a move to microservices is to increase the resiliency of your application–through load balancing across multiple redundant copies of a service, or by defining fall-back paths when complex application components fail (like serving static pages to a website when the database or application server are overloaded, for example). However, these techniques increase the management and communication overhead of running your application.
This is where Istio comes in. Istio is a collection of components, which work together to enable developers to manage microservice applications on Kubernetes, without having to deal with all of the intricacies behind the scenes.
Istio runs an Envoy side-car container in every pod in your Kubernetes application. The side-car serves as a service proxy—a type of traffic cop that decides what traffic can be passed through and where it should go.
Istio is a control plane (like a command center) for your application, issuing instructions to the individual Envoy nodes in your application to enable features including traffic management, security, policy enforcement, and observability. You can think of this as a kind of central operating center for the application network, with people on the ground at each intersection receiving instructions on what to do to manage the traffic they see.
This allows an application developer to benefit from some of the things enabled by microservices while making (almost) no changes to their application. Benefits like:
- A/B testing: When you have a new version of (for example) a recommendation engine, and you want to see which one generates more sales, you can run both at the same time, and divert a small amount of traffic to the new version, to test whether it performs better. If it does, you can easily switch all your traffic to the new version.
- Load balancing: If a service is stateless (meaning that the application node does not store any information about the connections it receives), then you can start multiple instances of the service, and spread the traffic across multiple nodes, enabling you to scale on demand.
- Circuit breakers: Since you can detect service failures and degradation using the observability features of Istio, it is fairly straightforward to configure fall-back services when something goes wrong, or to remove a defective node from a load-balanced pool.
- Access control: With Istio you can enforce with policy which services and users can call each service, to ensure that no-one except your application server is reading from your database, or that only authorized users are writing updates.
Each of these capabilities can be added to your application with minimal code changes, since they are being controlled by the side-car containers from Envoy.
The primary way to configure Istio is through YAML configuration files, which makes it tricky to get started, and complicated to visualize your application and the traffic flow behaviour in it.
Enter Kiali. Kiali is a graphical dashboard, visualization tool, and user interface for Istio. It allows you to view and modify the Istio configuration for your application directly in your web browser, and to visualize the behaviour of your application.
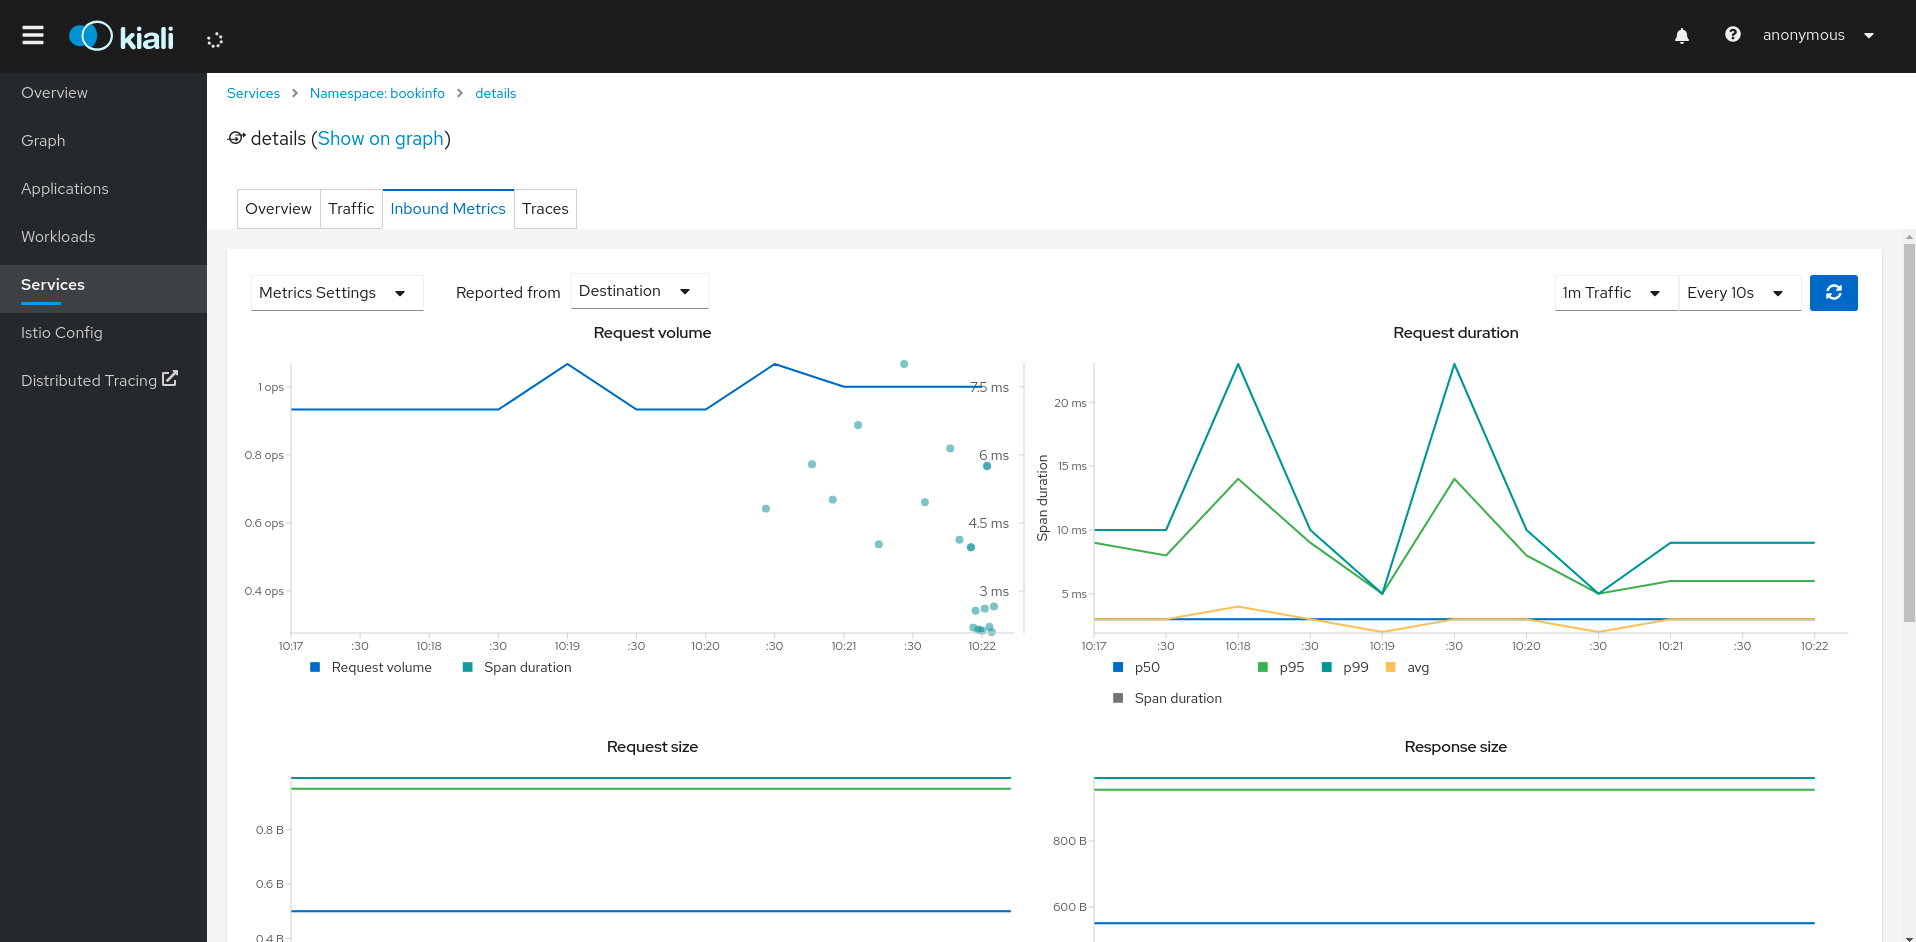
Prometheus integration for monitoring
The main view for Kiali is the service topology graph. It shows the connections between the various services in your application, and allows you to see at a glance whether any services are not working correctly. From the graph view, you can drill down to see what is happening in an individual node. And you can see an animation view of traffic flow through your application.
Kiali also integrates with services other than Istio. It uses Prometheus as a source of metrics for monitoring, and can display dashboards from Grafana. Kiali also uses Jaeger for distributed tracing, enabling the developer to see the path of a request as it goes through multiple services—and then being able to understand where most of the time is spent in that end to end trace. By combining all of these services, you can use Kiali to identify networking and performance issues quickly and easily, and get detailed information to help resolve them.
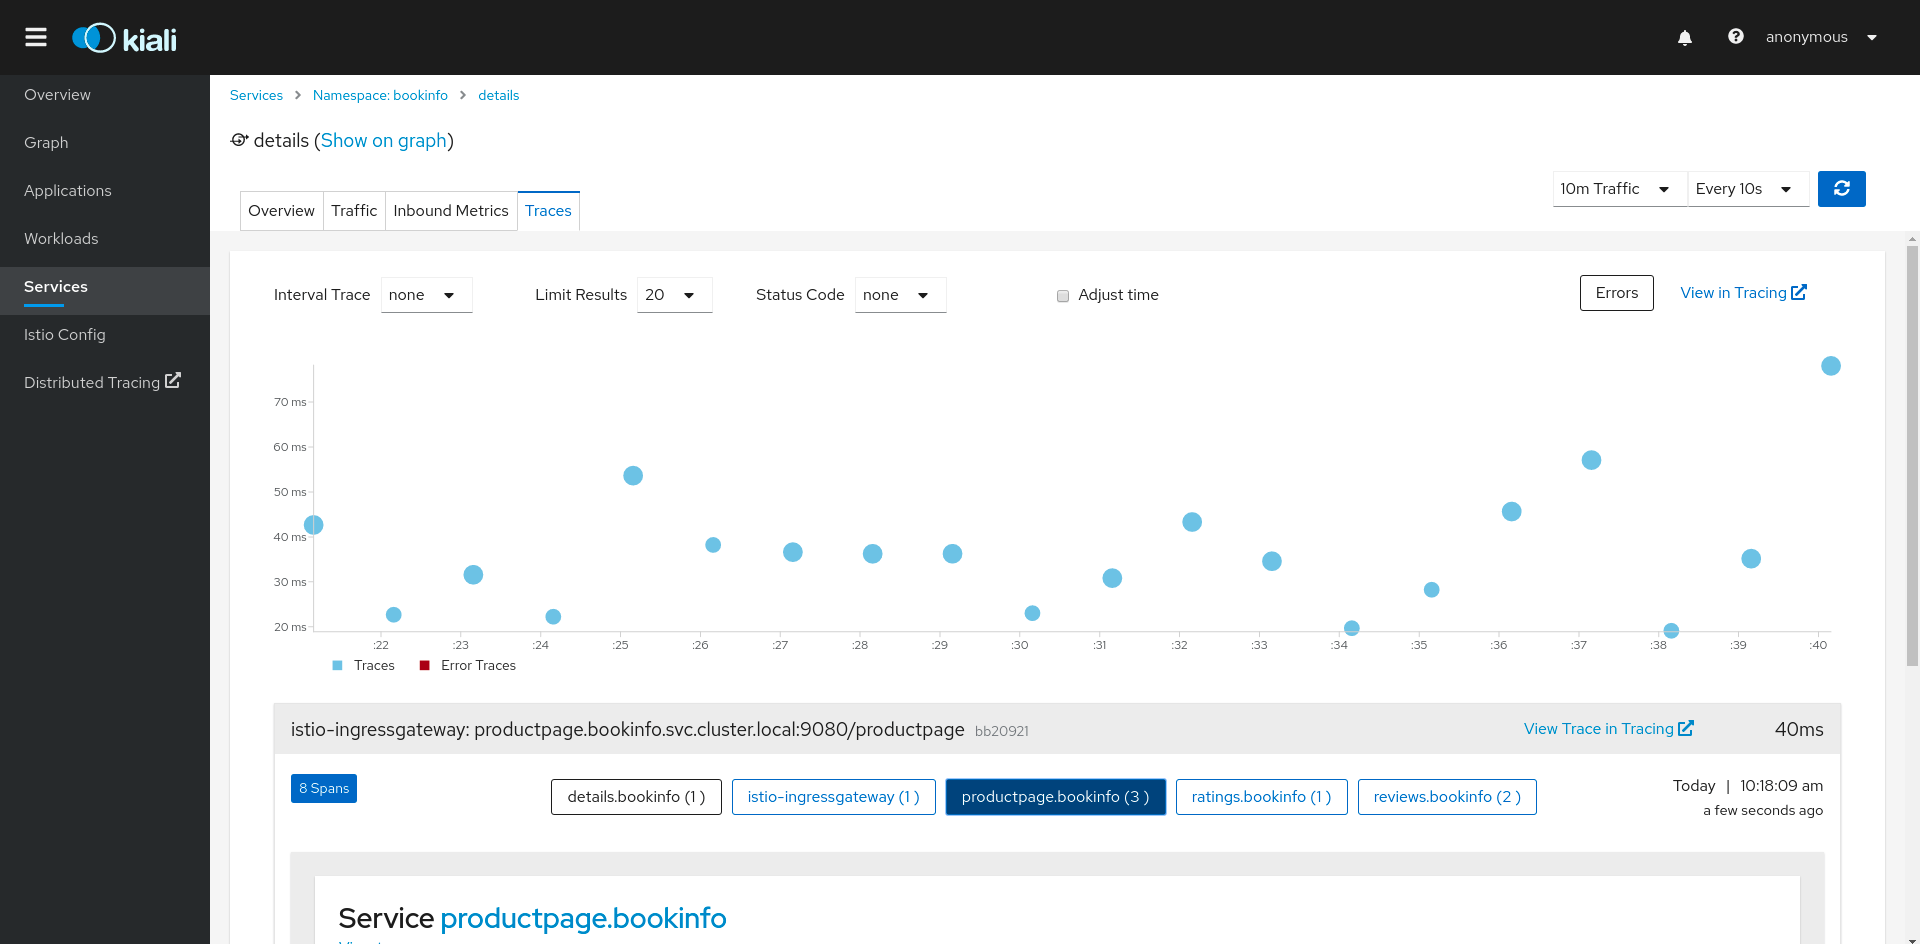
Using Jaeger for application tracing
One of the most convenient aspects of Kiali is the way it helps you manage YAML config files for Istio: you can modify Istio configurations directly from the browser, create valid config files in the web UI using pre-prepared wizards, and validate the config files afterwards to ensure that they are correct.
For developers approaching container application development, who are having difficulty with microservice application development, Istio and Kiali are enormously useful. Combined, they give you the ability to move from monolithic to distributed application development without understanding every facet of distributed application development on day one.
Where Istio brings a central brain to how traffic flows through your application, Kiali provides the interactive dashboard that makes it consumable by mere mortals, allowing you to reap some of the benefits of microservices without a PhD in cloud application development.